


If you run a website that makes money from display ads, one metric matters more than almost any other: RPM, or revenue per mille (per thousand pageviews). It tells you roughly how much your traffic is actually worth. The Website RPM Estimator is a simple tool built to answer one question fast. Based on my niche, my traffic volume, and where my visitors are coming from, what should I realistically expect to earn?
This is a breakdown of how the tool works, what’s happening behind the numbers, and how to use the output.
What RPM Means (and Why It’s Different From CPM)
RPM and CPM get confused constantly, so it’s worth separating them first.
CPM (cost per mille) is what an advertiser pays for 1,000 ad impressions. It’s a buyer side number.
RPM (revenue per mille) is what a publisher actually earns per 1,000 pageviews. It’s a seller side number, and it’s almost always lower than CPM, because:
- Not every pageview shows an ad (viewability issues, ad blockers, unfilled inventory)
- A single page might show multiple ad units, but the RPM math is still normalized per 1,000 pageviews, not per 1,000 impressions
- Ad networks and exchanges take a cut before revenue reaches the publisher
So when this tool outputs an RPM range, it’s estimating your realistic take home rate, not the raw price advertisers are bidding.
The Three Inputs That Drive the Estimate
The tool asks for exactly three variables, and each one exists because it materially changes ad value.
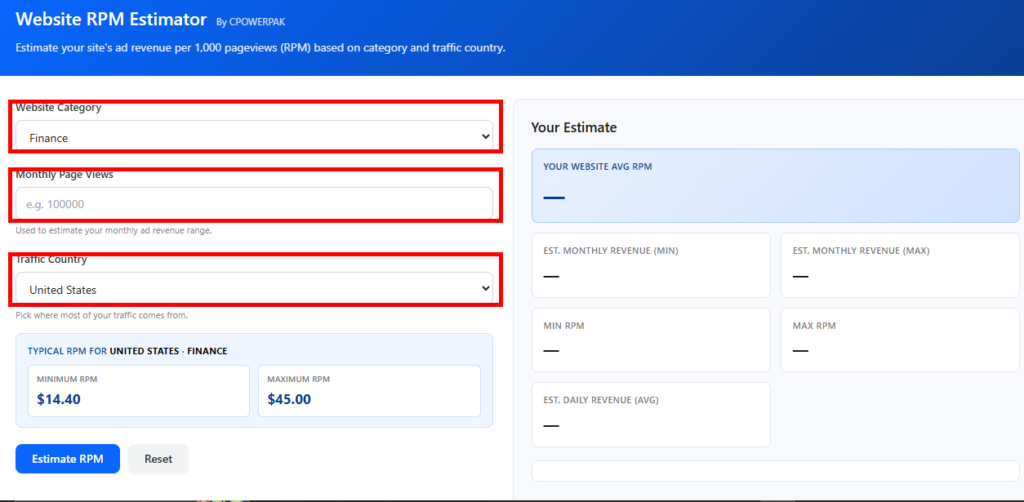
1. Website Category
This is the single biggest lever in the calculation. Advertisers don’t pay the same price for every kind of attention. A visitor reading about mortgage refinancing is, from an advertiser’s perspective, worth far more than a visitor reading a meme roundup, because that visitor might be about to make a decision involving thousands of dollars. Advertisers in finance, insurance, and B2B software are willing to bid aggressively to reach them.
That’s why “Finance” is selected in the example, and why finance sites consistently post some of the highest RPMs of any content category. Categories like insurance, legal, technology, and business tend to cluster at the top. Categories like entertainment, general lifestyle, and humor tend to sit lower, simply because the audience isn’t in a high intent buying mindset when they’re consuming that content.
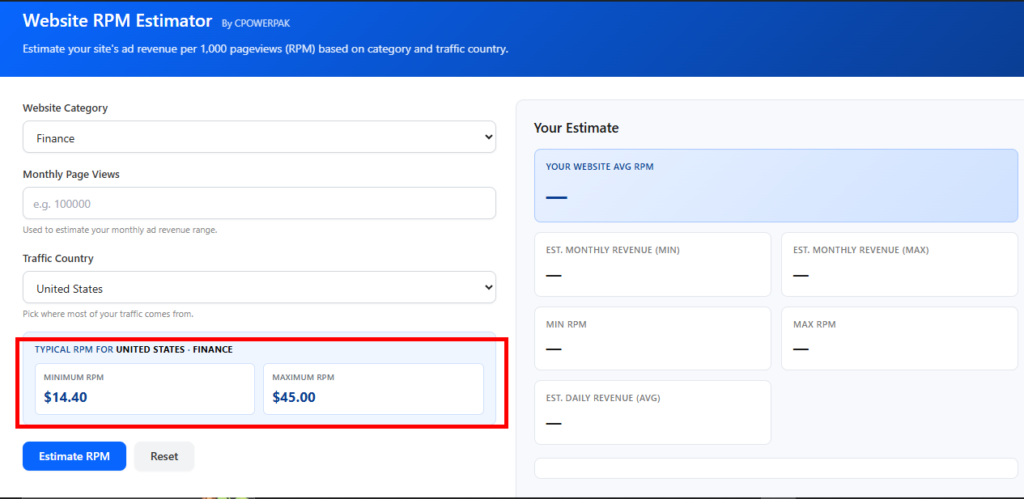
Internally, the tool is likely mapping each category to a baseline RPM range pulled from aggregated industry benchmarks, data typically sourced from ad network reporting, publisher surveys, and platforms like Google AdSense or Ad Manager averages. Rather than giving one fake precise number, it gives a range, because real world RPM varies by ad density, placement, viewability, and seasonality even within the same niche.
2. Monthly Page Views
This input doesn’t change your RPM rate. It changes the dollar output. RPM is a rate (dollars per thousand views), so the tool takes your monthly pageview volume, divides it by 1,000, and multiplies by the RPM range to produce an estimated monthly revenue range.
The formula is straightforward:
Estimated Monthly Revenue = (Monthly Pageviews / 1000) x RPM
Since the tool shows both a minimum and maximum RPM, it runs this calculation twice, once against the low end and once against the high end. That’s why you get an Est. Monthly Revenue (Min) and an Est. Monthly Revenue (Max) rather than a single number. This is more honest than presenting a fake precise average, since actual ad revenue fluctuates based on factors the tool can’t see: your specific ad network, layout, seasonality, and advertiser demand at any given moment.
3. Traffic Country
Geography is the third major multiplier, and it’s arguably as important as content category. Advertisers pay very different rates depending on the purchasing power and market maturity of the audience they’re reaching. Traffic from the United States, United Kingdom, Canada, and Australia, often grouped as Tier 1 traffic, commands the highest CPMs because advertisers in those markets have larger budgets and more competitive bidding. Traffic from developing ad markets typically earns a fraction of that rate, even for identical content and identical pageview volume.
That’s why “United States” is set as the traffic country in the example. It functions as a multiplier on top of the category baseline. A finance site with mostly U.S. traffic will land near the top of the entire RPM spectrum. That same content with traffic from a lower CPM region could see RPM drop to a tenth of that figure or less.
How the Output Is Structured
Once you hit “Estimate RPM,” the tool populates six figures:
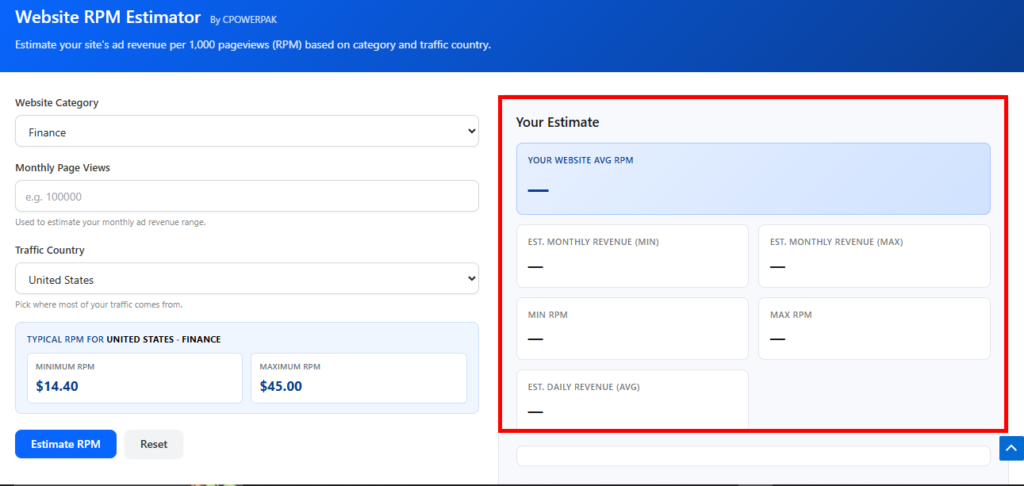
- Your Website Avg RPM. Likely the midpoint or a weighted average between the min and max RPM for your category and country combination, giving you one headline number to anchor around.
- Est. Monthly Revenue (Min/Max). The pageviews driven dollar range described above.
- Min RPM / Max RPM. The underlying rate range being used for the calculation, shown transparently so you can see exactly what assumptions are driving your revenue estimate.
- Est. Daily Revenue (Avg). Likely the average monthly revenue divided by roughly 30, giving you a day to day sense of cash flow rather than just a monthly lump sum.
Showing the underlying RPM alongside the revenue estimate is a smart design choice. It lets you check the tool against your own AdSense or ad network dashboard. If your actual RPM comes in below the tool’s minimum, that’s a signal your ad setup (placement, viewability, ad density, header bidding) has room to improve. If you’re beating the max, you’re likely already running a well optimized monetization stack.
What the Tool Simplifies
It’s worth being clear about the tool’s limitations, because that’s what makes it useful rather than misleading.
The tool doesn’t know your actual ad setup. Two sites in the same category and country can have very different real RPMs depending on ad network, number of ad units, viewability, and page speed.
It uses category and country as proxies, not guarantees. A “Finance” site about basic budgeting content won’t necessarily earn the same as one about high intent topics like best mortgage lenders. It doesn’t account for seasonality. RPMs across nearly every category spike in Q4, October through December, due to holiday ad spending, and drop in January. A single static estimate can’t capture that swing.
It’s directional, not a guarantee. The tool is best used to answer whether a niche and traffic mix is roughly viable, rather than exactly how much you will earn next month.
The Real Value of a Tool Like This
A calculator like this is genuinely useful because it turns an abstract question, is my niche profitable, into a concrete, comparable number before you’ve invested months building content. A creator deciding between a finance blog and a pop culture blog can see, instantly, that the finance site is likely to out earn the entertainment site by 5 to 10 times at the same traffic level, purely due to advertiser demand. That’s a strategic insight, not just a fun widget, and it’s exactly the kind of practical, numbers first content that tends to perform well as blog material in the marketing and advertising space, since it gives readers something they can apply immediately rather than just theory.